
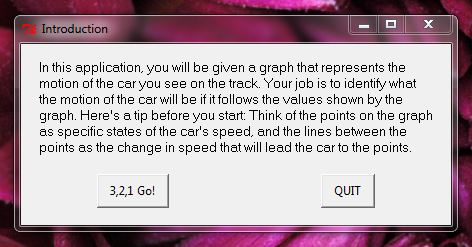
The game consists of three graphs with four questions each. When the students first open the application, the screen above would show. The player clicks “LET’S GO!” and gets a brief description of how the game works.
Then, the player has to choose between an Easy, Hard, or Challenge graph:

I’ll take you through each of the three graphs and the questions we chose for each of them.
Graph 1, the “Easy” graph, consists of all positive speeds. All the questions referred to the speed, whether the car was speeding up, slowing down, maintaining a constant speed, or stopped.
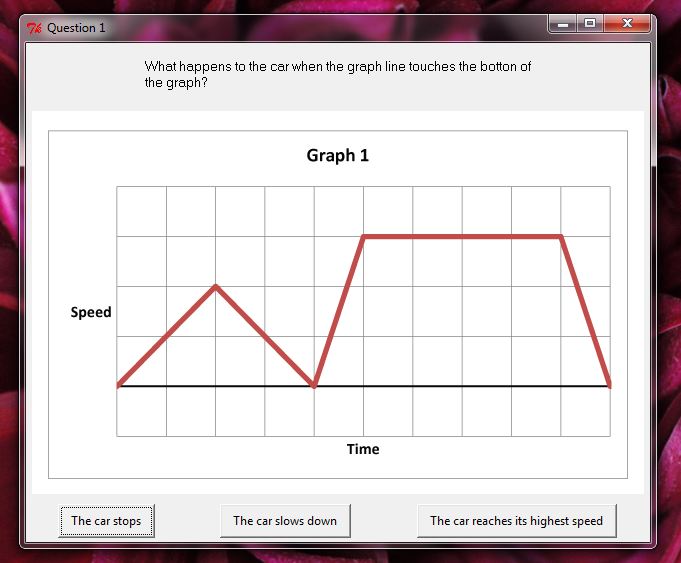
Above is an image of the first question from the first graph. The question at the top reads, “What happens to the car when the graph line touches the bottom of the graph?” and the three button choices on the bottom read, “The car stops”, “The car slows down”, and “The car reaches its highest speed.”
The correct answer is “The car stops”. However, if the student clicks one of the other two responses, the following screen pops up:
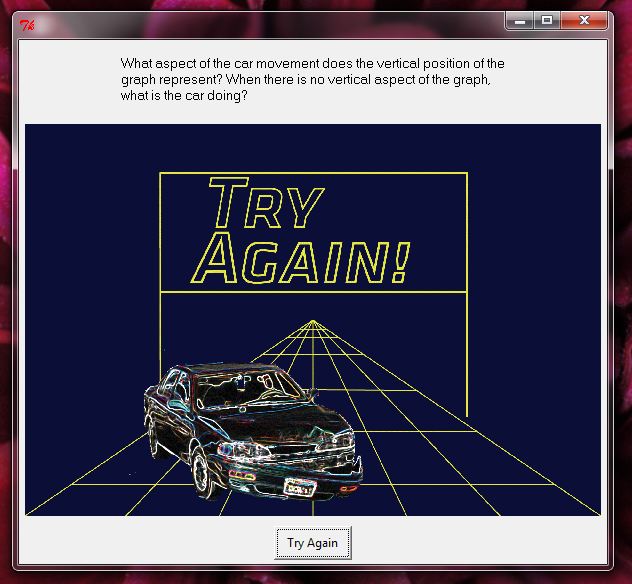
Notice that at the top of the screen we try to guide the player into thinking about the graph correctly so that he can come to the right conclusion when he is given the chance to try again. When the player clicks “Try Again” he is brought back to the graph with the same question.
If the player clicks the correct answer, “The car stops”, the following screen pops up:
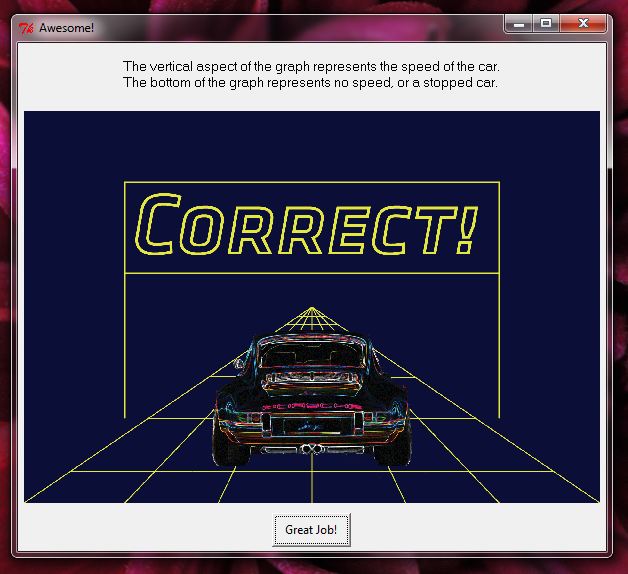
Notice how we put in an explanation of the answer. This way, if the student randomly guessed correctly, he will still learn about why the answer is correct.
These are the following three questions for Graph 1:
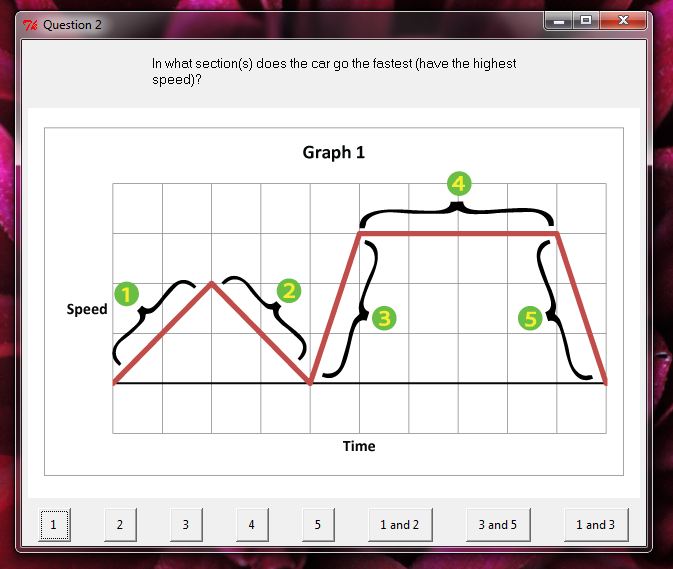
2. In what section(s) does the car go the fastest (have the highest speed)?
In this question we labeled the line segments instead of the points, as seen above.
Correct Answer: “4”
Correct Explanation: The vertical aspect of the graph represents the speed of the car. The highest part of the graph is section 4, it is the furthest from 0 speed.
Try Again Explanation: What aspect of the graph represents the speed of the car? When is this part the highest?
3. What is happening in section 1?
Correct Answer: “The car is speeding up”
Correct Explanation: Because the line of the graph is sloped upward, it represents an increasing speed.
Try Again Explanation: What does the steepness of the line mean? What happens to the car as the graph gets higher?
4. What is the difference between section 1 and section 4?
Correct Explanation: The steeper line represents a bigger increase in speed in a smaller period of time.
Try Again Explanation: What does the steepness of the line mean? What happens to the car as the graph gets higher? What does the horizontal distance each segment mean? The vertical distance?
Once the students correctly answered all four questions, they were able to look at the graph one more time.
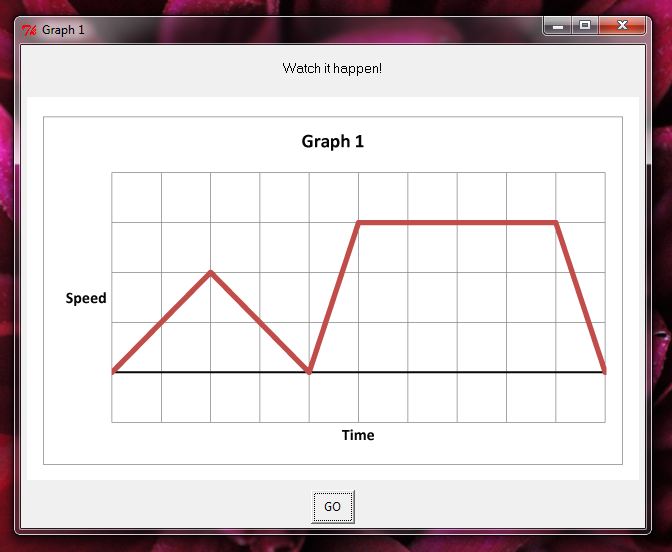
When the student clicks “GO” the slot car on the racetrack drives according the speed profile in shown in the graph. The students can then see what the graph means, in real time.
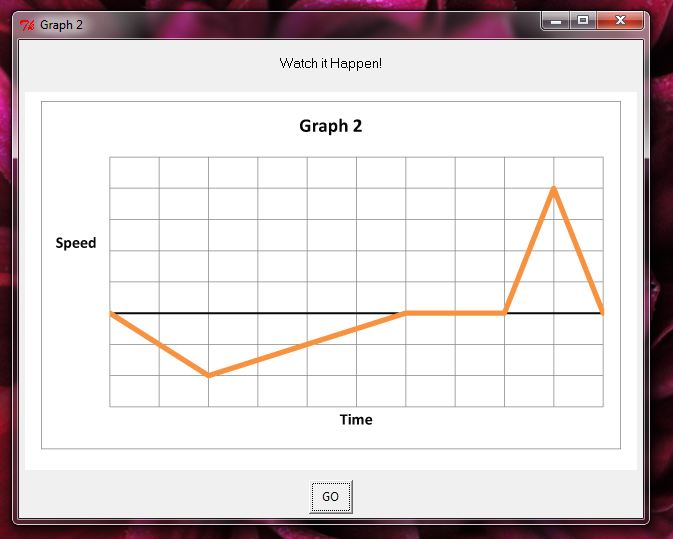
Graph 2 has the same format of four questions. However, these questions are slightly more difficult that Graph 1’s. They encompass not only the vertical axis (speed), but also the horizontal axis (time). We also introduce a negative segment of the graph, where the car goes backward.
 1. What happens to the car as you read the graph from left to right?
Correct Answer “Time goes forward”
Correct Explanation: The horizontal aspect of the graph represents time. As you read the graph from left to right, time moves forward. When the graph goes below the horizontal axis, it means that the speed goes negative – the car goes backward
Try Again Explanation: What does the horizontal aspect of the graph represent? What changes as you read the graph from left to right? Keep in mind that the car goes both forward and backward in this graph.
2. At what point does the car reach its highest speed?
Correct Answer: “E”
Correct Explanation: The vertical aspect of the graph represents speed. As the graph gets further from the horizontal axis, the speed gets higher.
Try Again Explanation: What aspect of the graph represents speed? Is it the distance from the horizontal axis or Is it the angle of the line? At what point of the graph is this the biggest, or highest?
3. What is happening in section 2?
Correct Answer: “The car is slowing down”
Correct Explanation: Even though section 2 is slanted upward, it represents the car slowing down. This is because the line is getting closer to the 0 axis as time goes forward. The (negative) speed is getting smaller and smaller.
Try Again Explanation: What does the distance from the horizontal axis mean? What changes when the graph is below the x-axis? Imagine flipping section 2 over the horizontal axis. What would that mean?
4. What is the difference in the car movement between section 4 and section 5?
Correct Answer: “In section 4 the car is speeding up, while in section 5 the car is slowing down.”
Correct Explanation: Section 4 and section 5 have the same steepness. Section 4 has a positive angle, so it represents the car speeding up, while section 5 has a negative angle, so it represents the car slowing down. Because they have the same steepness and the same length, it takes the same time for the car to speed up from 0 to the maximum speed (section 4) as it takes to slow down to 0 from its maximum speed (section 5).
Try Again Explanation: What is the same between the graph lines of section 4 and section 5? What is different? What does this difference represent? Remember that as you read the graph left to right, time increases, and that when the graph line goes further from the horizontal line, the speed increases.
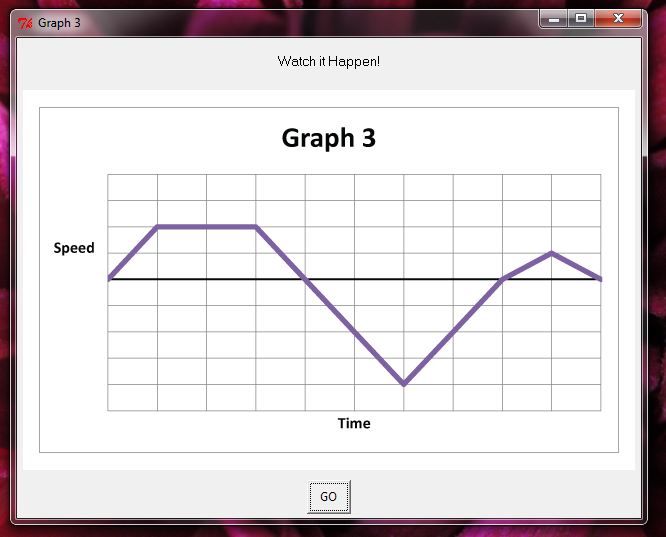
Graph 3 is the challenge graph. It has the toughest questions. We even ask one about distance traveled.
 1. Which direction is the car moving in section 4?
Correct Answer: “Backward”
Correct Explanation: The car is moving backward! This is because the speed of the car is negative. Even though section 4 has a positive steepness, the line is under the horizontal axis, making the speed under 0.
Try Again Explanation: What does the vertical aspect of the graph mean? (Hint, look at the label next to the vertical axis?) What does it mean if this is under the horizontal axis (under 0)?
2. Which correctly describes the motion of the car in section 2?
Correct Answer: “The car has a constant speed”
Correct Explanation: In section 2, the car is not speeding up, nor is it slowing down. It is maintaining a constant speed. This is shown by the lack of a change in the vertical (speed) aspect of the line.
Try Again Explanation: What is unique about section 4? What does it mean that it doesn’t get higher or lower? What part of the graph shows the speed of the car? (Hint, look for the label: “speed”).
3. At what point is the car moving the fastest (have the highest speed)?
Correct Answer “E”
Correct Explanation: The car moves fastest when the point on the graph is furthest from the horizontal axis. At point E, the car is moving backwards, so it has negative speed. However, the magnitude of this speed is greater than the speed at any of the positive peaks.
Try Again Explanation: Which aspect of the graph shows the speed of the car? Where is this part the highest? Where is it the furthest from 0? Does it matter if the car is going forward or backward?
4. Does the car move further from points A to D or points F to H?
Correct Answer: “A to D”
Correct Explanation: The car moves furthest from points A to D. It has more time and attains a higher speed.
Try Again Explanation: What factors influence how far the car goes? If the car goes fast and has more time to go, will it go faster than when it goes slow for a short period of time?
That’s it!